Help
Short guides for every part of Tradeino. Can't find your answer? Email Tradeino.support@gmail.com.
Getting started
- Create an account and sign in — Tradeino asks what to call you, then you land on the Dashboard. Your data is private and only visible to you.
- Check your timezone in ⚙ Settings (bottom of the left menu). All times in Tradeino use it.
- Open Journal and import your Tradovate trades (see below), or add trades by hand. Review a few trades and add chart screenshots.
- Open Psychology to see what you do well, what's hurting you and what to fix first.
- Log the prop-firm evaluations you've bought in Eval Costs.
- Use the Dashboard to prepare for the week and Lot Size before each trade.
Tradeino on your phone
There's no Tradeino app in the App Store yet, but you can add Tradeino to your iPhone's home screen. It then opens full screen from its own icon, just like an app. The first time you open it, sign in once.
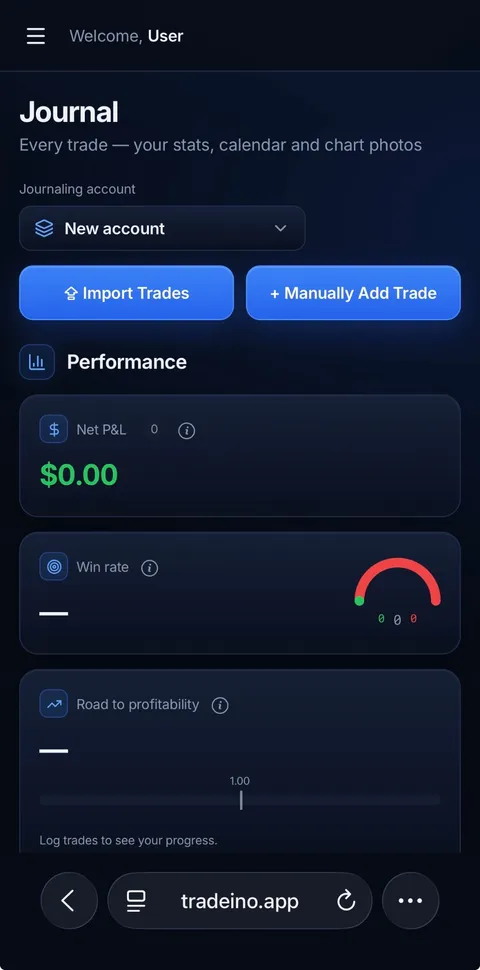
1In Safari, open tradeino.app and tap the ••• button at the bottom right.
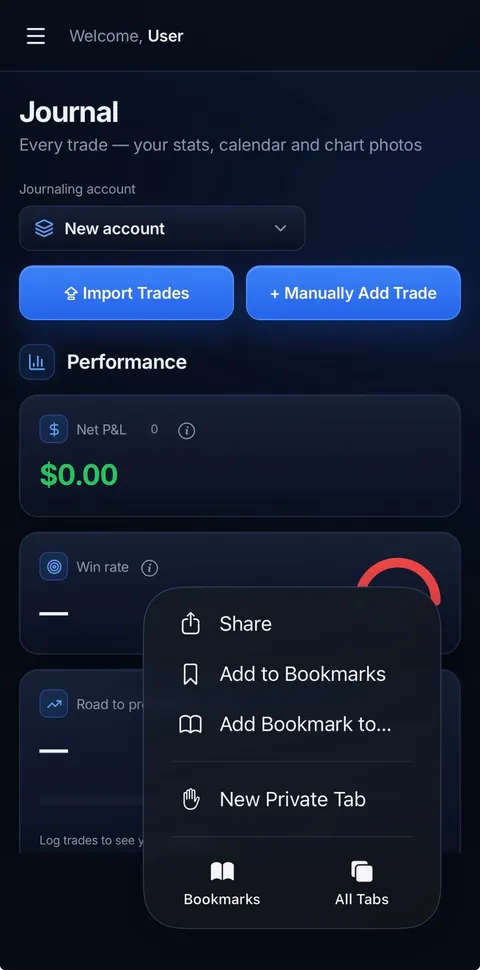
2Tap Share.
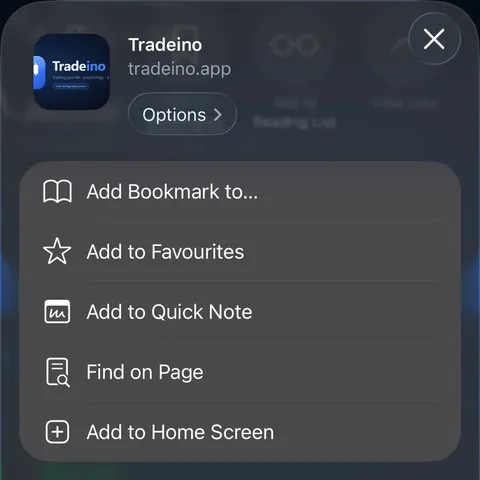
3Scroll down if needed and tap Add to Home Screen.
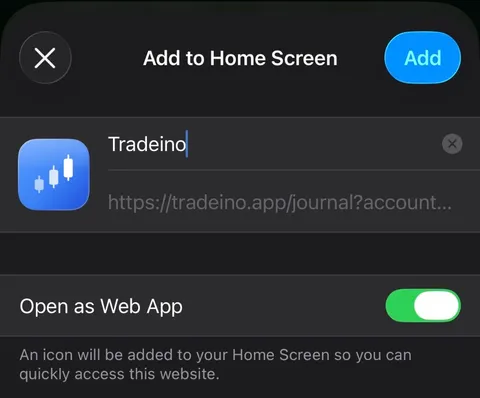
4Leave Open as Web App on and tap Add.
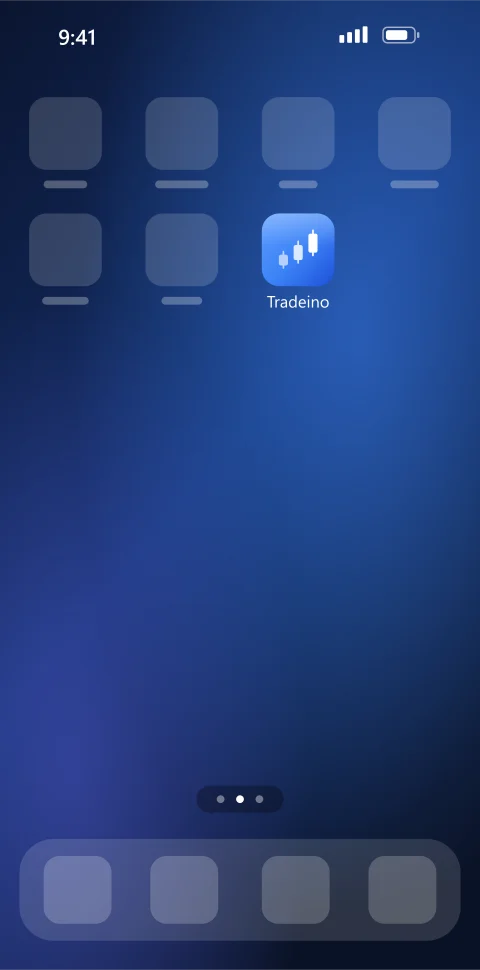
5Done — open Tradeino from its icon on your home screen, like any app.
- On some iPhones the Share button (a square with an arrow ↑) is right in Safari's bottom bar — tap it and continue from step 3.
- Android: open tradeino.app in Chrome, tap ⋮ (top right), then Add to home screen or Install app.
Journal
Importing trades from Tradovate
Click ⇪ Import Trades on the Journal tab. To get the file:
📘 How to get the CSV file from Tradovate
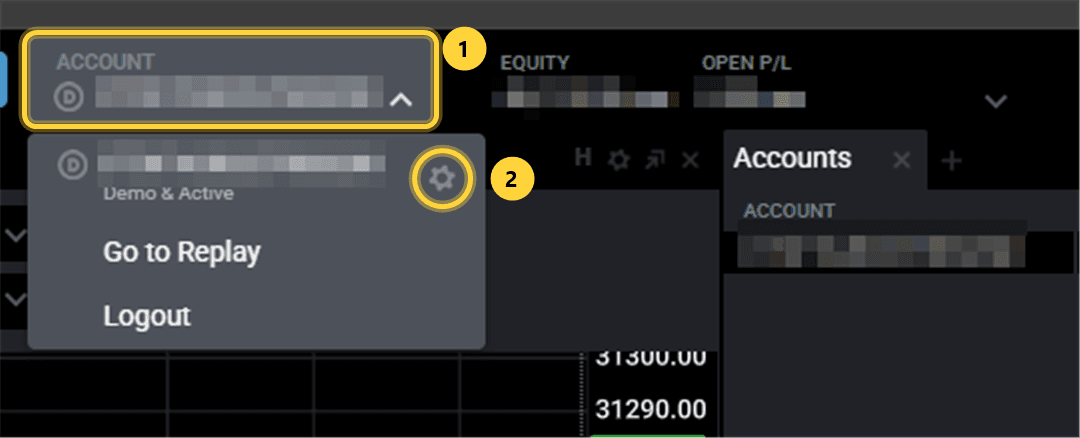
- In Tradovate, click your account in the top-right corner. 1
- Click the ⚙ gear next to the account name — this opens your account reports. 2
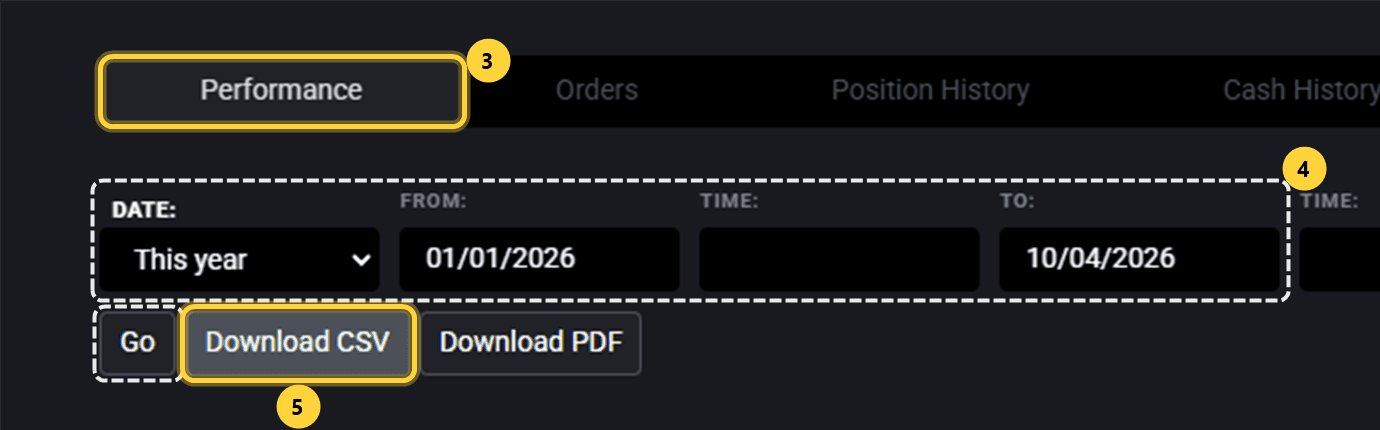
- Open the Performance tab. 3
- Choose the dates you want (for example "This year") and click Go. 4
- Click Download CSV. 5
- In Tradeino, open Journal → ⇪ Import Trades and click 📂 Choose your CSV file (or drag the file in). Importing the same file again is safe — trades already in your journal aren't duplicated.
- Times look shifted? In the import window, switch "Times in this file are in" (your time ↔ UTC) and import the same file again — it corrects the times without making duplicates.
- Importing the same file twice is safe: trades already in your journal are updated, never duplicated.
- File won't import? Make sure it's the Performance report (not Orders or Fills) and that you didn't open and re-save it in Excel first. The import window says exactly what's wrong — for example a missing column — and how many rows it skipped. Large files are imported in parts automatically.
- Your own notes (risk, setup, emotion, rules, mistakes, reflection) and photos are never overwritten by an import.
Adding a trade by hand
Click + Manually Add Trade, fill in what you know, and click Add trade. Only the result is required.
Accounts
Click the account name at the top of the Journal to switch accounts (or pick "All accounts"). In the same menu, click ✎ next to an account to rename it (or delete it with the bin icon), and + Add account at the bottom to add one — for example one per prop-firm or broker account. Deleting an account moves its trades to another account.
Risk and R multiples
Tradovate's export doesn't include your stop, so imported trades show R = —. Type the Risk $ into a trade in the History table and press Enter: its R multiple and your Avg R appear.
Reviewing a trade
Click ✎ Review on any trade in the History table (imported ones too) to record your setup, risk, how you felt going in, whether you followed your rules, any mistakes (moved stop, FOMO entry, revenge trade…) and a reflection. Importing again never overwrites a review.
Trade photos
- In the review window, add up to 4 photos per trade: take a screenshot (Windows: Win+Shift+S, Mac: Cmd+Shift+4) and press Ctrl+V (Mac: Cmd+V), drop an image in, or choose a file. Photos save straight away.
- Or paste a TradingView snapshot link (camera icon → "Copy link to the chart image"). Links don't count towards your photo limit.
- Photos are shrunk before upload and stored privately — only you can see them. You can keep up to 300 uploaded photos; delete old ones to make room.
- Days with photos show a small square in the calendar — click it to see that day's photos. Turn it off with ⚙ → Trade photos.
- Trade photos below the P&L chart is your gallery for the month shown (or All). Click a photo to see it large; use ← → to browse and ✎ Edit trade to open its review.
- Deleting a trade also deletes its photos.
Psychology
- What's costing you shows your single most expensive mistake or habit so far, in money, and how many of your trades you've reviewed.
- Your feedback tells you what you do well, what's hurting you (in money) and the top 3 things to focus on next, each with a concrete tip. It works from your trades alone once you have 10 — best and worst hours and weekdays, longs vs shorts, which symbols lose, whether you hold losers longer than winners, and the patterns described next — and gets more detailed as you review (rules, emotions, mistakes). If several findings are about the same trades, it shows them once.
- Patterns in your trading are found automatically from your trades — no review needed: trades after your first loss of the day, quick re-entries within 15 minutes of a loss (revenge trading), sizing up after a loss, and overtrading days. Each compares those trades with all your others; a comparison appears once both sides have at least 5 trades. Trades on different accounts are checked separately, so copying a trade to several accounts doesn't count as overtrading.
- From your reviews compares trades where you followed your rules with ones where you didn't, and shows results by mistake tag and by emotion.
- Your trades has two lists: To review and Reviewed. Use ✎ Edit to change a review and Remove to clear it (the trade and its risk stay). In the Journal, reviewed trades show ✎ Edit, and the review window has a Remove review button.
Eval Costs
- Click + Add evaluation for every evaluation you buy — passed or not. Everything saves as you type.
- Click the 📅 dates to set start and end; the duration is worked out for you.
- Set the status to Passed and a funded-account row appears below it for the activation fee and payouts. Use the switch to mark it Active or Closed.
- The Total P&L shows your real all-in result: payouts minus every evaluation cost and fee.
Dashboard
- Sessions change with your market. For forex pairs you see the busy first three hours after Sydney, Tokyo, London and New York open. For indices, gold, oil and crypto you see ICT-style sessions: Asia, London (09:00–12:00 central European time), NY AM and NY PM. Each card shows whether it's on now, when it next opens or closes, and its hours in your timezone; summer/winter clock changes are handled automatically. No sessions are shown at the weekend, when forex and futures are closed (Friday 17:00 to Sunday 17:00 New York time). Bank holidays aren't included.
- Your market: pick the one market you're trading from the list; Tradeino remembers it. NAS100, SPX500 and US30 follow the same indices as the NQ, ES and YM futures (TradingView doesn't allow live futures prices in free widgets).
- Next to the chart (current price, change and recent movement) is the analysis for that market — see below.
- This week's news shows only the high- and medium-impact releases that move your market — for GBPUSD that's GBP and USD news. Each card shows which way your market has usually moved on each outcome: ▲ green = it has usually risen, ▼ red = it has usually fallen. Hover over or tap the ⓘ next to a title to see what the release is. Releases already out are folded away at the bottom. Use ‹ Previous week / Next week › to look at other weeks; weeks run Monday–Sunday, and at the weekend "This week" already shows the coming week.
- The analysis has three tabs — Summary, What could move it and When to trade — and sums up the week for your market: the recent price trend (currency pairs, from daily ECB reference rates), the key event and busiest day, what would usually push it up or down, the hours it usually moves most, and the high-impact news times to be careful around. It's built automatically from the schedule and past prices — context, not a prediction or a signal.
Lot Size calculator
Pick your symbol, enter your balance, risk and stop loss, and read the lot size to enter in MetaTrader. Lot sizes are rounded down so you never risk more than planned.
📘 How to use it — example with a chart
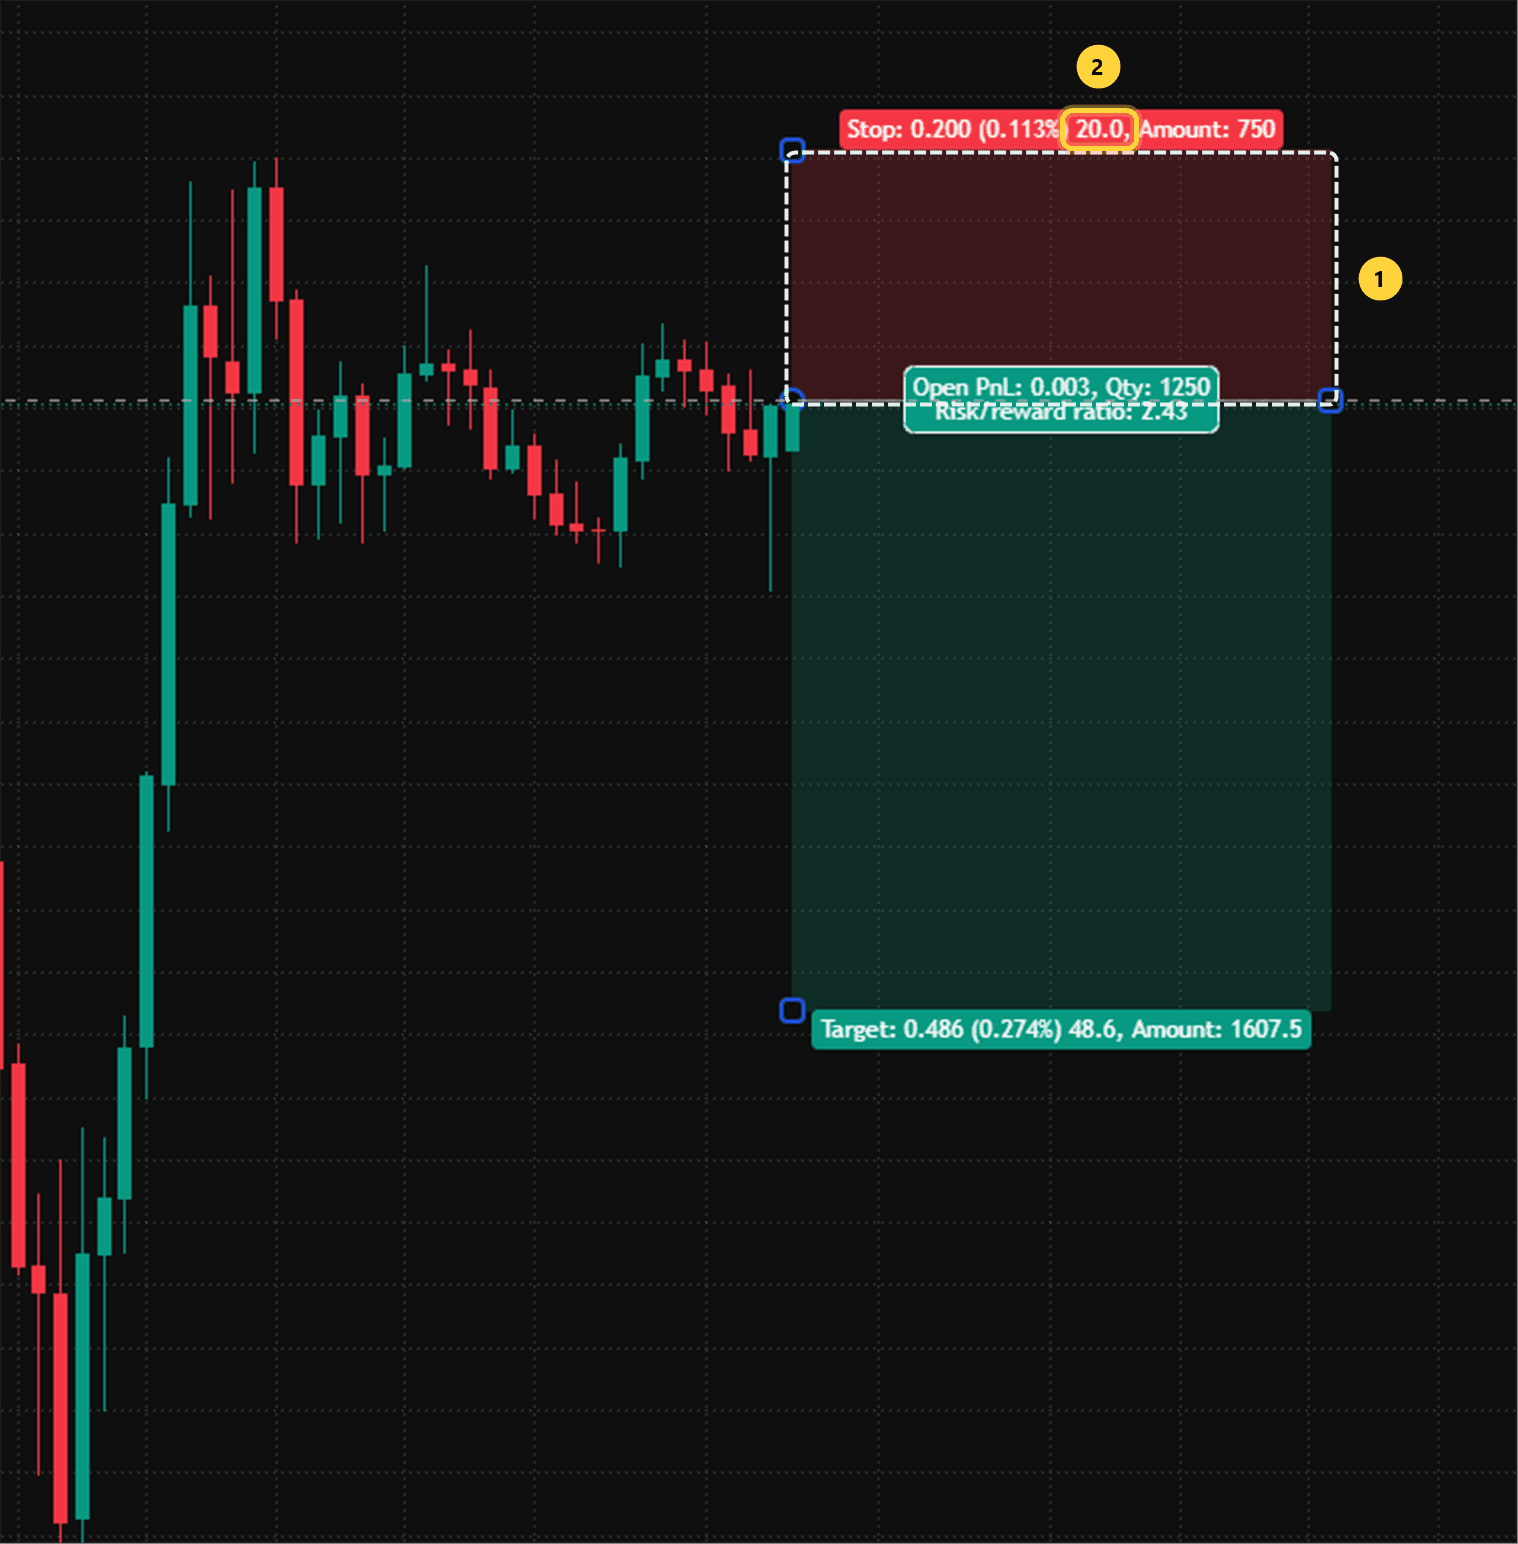
- Draw your trade on the chart with the Long / Short Position tool (TradingView) and drag the red stop box to where your stop loss goes. 1
- Read the stop label. In Stop: 0.200 (0.113%) 20.0 the 20.0 is your stop distance in pips. (0.200 is the same distance in price, 0.113% in percent.) 2
- In the calculator pick the same symbol, set Stop loss → Distance in pips and type 20.
- Set your balance and risk, then open the trade in MetaTrader with the lot size shown on the right.
Contract specs (indices, oil, crypto)
Brokers use different contract sizes for these, so check them once: in MetaTrader, Market Watch → right-click the symbol → Specification, then copy Contract size and Volume step into the "Contract specs" box. Tradeino remembers them per symbol. For anything not in the list, choose Custom symbol.
Settings
- Open ⚙ Settings (bottom of the left menu, above Help) to change your name (used in the welcome when you sign in), switch between dark and light theme, choose the currency amounts are shown in, and set your timezone.
- The timezone is used for the clock, sessions, news times and every trade time. Tradeino picks your computer's timezone the first time you sign in.
- Your settings are saved to your account, so they follow you to any device.
Glossary
- Net P&L
- Your total profit or loss after fees, across the trades shown. The small number is how many trades it includes.
- Win rate
- The share of trades that made money. The gauge shows wins (green), break-even (grey) and losses (red).
- Road to profitability (profit factor)
- Total money won ÷ total money lost. Above 1.00 means your trading is profitable overall; 2.00 means you win twice what you lose.
- Avg win/loss trade
- Your average winning trade ÷ your average losing trade. Above 1.00 means your winners are bigger than your losers.
- Avg R
- Your average result measured in R — how many times your risk you made or lost per trade. +1R means you made what you risked.
- R multiple
- A trade's result ÷ the money you risked on it. Risk $100 and make $250 = +2.5R. Needs a Risk $ on the trade.
- Risk ($)
- How much you would have lost if your stop loss was hit. Tradovate's export doesn't include it, so type it into the trade.
- All-in P&L (Eval Costs)
- Payouts received − evaluation costs − activation fees. Every evaluation counts, passed or not — your real prop-firm result.
- Activation fee
- The one-off fee some prop firms charge to turn a passed evaluation into a funded account.
- Pip
- A standard small price move: 0.0001 for most forex pairs, 0.01 for JPY pairs. Gold usually counts 0.10 as one pip.
- Point
- For indices, oil and crypto the stop is measured in points — the price move shown next to the stop box, e.g. 1.00 for NAS100.
- Contract size
- How many units are in one lot — e.g. 100,000 for forex, 100 oz for gold. Find it in MetaTrader: right-click the symbol → Specification.
- Lot step
- The smallest amount you can change a position by in MetaTrader ("Volume step"), usually 0.01.
- Pip / point value
- How much money one pip (or point) is worth for a given position size, in your account currency.
- Impact
- How much an economic release usually moves the market: red = high impact, orange = medium. Smaller releases aren't shown.
- Forecast / Previous
- Forecast is what economists expect; Previous is the last reading. Markets move most when the actual number surprises vs the forecast.
- Patterns in your trading
- Found automatically from your trades' times, sizes and results — no review needed. Each compares those trades with all your others.
- Revenge trading
- Jumping back into a trade soon after a loss to win the money back — usually bigger, faster and without a proper setup.
- Overtrading
- Taking far more trades than usual in a day, often after losses or out of boredom. Tradeino flags days with at least double your usual number of trades, and at least 3 more than usual.
- Tilt
- Trading while frustrated or emotional after losses, so decisions get worse. Mark it as the emotion "Tilted" when you review a trade.
- Hawkish / Dovish
- Hawkish = a central bank leaning towards higher rates to fight inflation. Dovish = leaning towards cuts to support growth.
FAQ
Is my data private?
Yes. Every trade, photo, account and evaluation is tied to your login, and the database only ever returns your own rows. Trade photos are stored privately — only you can see them.
Does Tradeino tell me when to buy or sell?
No. Tradeino is a journal and preparation tool. Nothing on it is a trading signal or financial advice — see the risk disclaimer.
Is there a Tradeino mobile app?
Not yet — but you can add Tradeino to your phone's home screen and use it like an app. See Tradeino on your phone.
Can Tradeino sync my trades automatically?
Not yet — automatic Tradovate sync is planned. Until then, import the Performance CSV; re-importing is always safe.
Why does the news show no actual numbers?
The schedule Tradeino uses includes forecast and previous values only. Check a live news source for the actual figure once it's released.
How do I delete my account or my data?
Email Tradeino.support@gmail.com from the address you sign in with, and we'll delete it. A self-service option is coming.